Journey of a data-driven win | How we improved ETA accuracy and cut expensive Google API costs

This post is a retrospective on building ETA (estimated time of arrival) feature at Shuttl. It’s structured as a story with technical details. I’ll cover some of the variables in this problem space, and our journey solving for it. The goal is to highlight how a data-driven approach has proven to be vital. With this binder - the collaboration among tech, analytics, and product teams, we were able to deliver superior product experience with dramatic cost reduction.
This is a slightly dense read, so get some coffee and strap in.
Story Background
Founded in 2015, Shuttl is India’s largest office commute service provider. Shuttl serves over 1,00,000 rides daily, covering 350+ long routes with a fleet of 2000 buses.
Our mission is to solve the pain of commute.
Tracking the location of the bus and its ETA is a critical part of that product experience. It’s a huge win if we can eliminate the franticness of daily commute and replace it with something reliable that requires little thought. (If you’ve ever commuted in Indian cities, you know how stressful it can be)
It’s not only customer experience at stake here; With a clear view of our fleet, we can optimize our operational efficiency. We can accept last minute bookings and still hold our guaranteed seat promise.
Great, now that we’ve established what we’re solving for let’s get into some technical details.
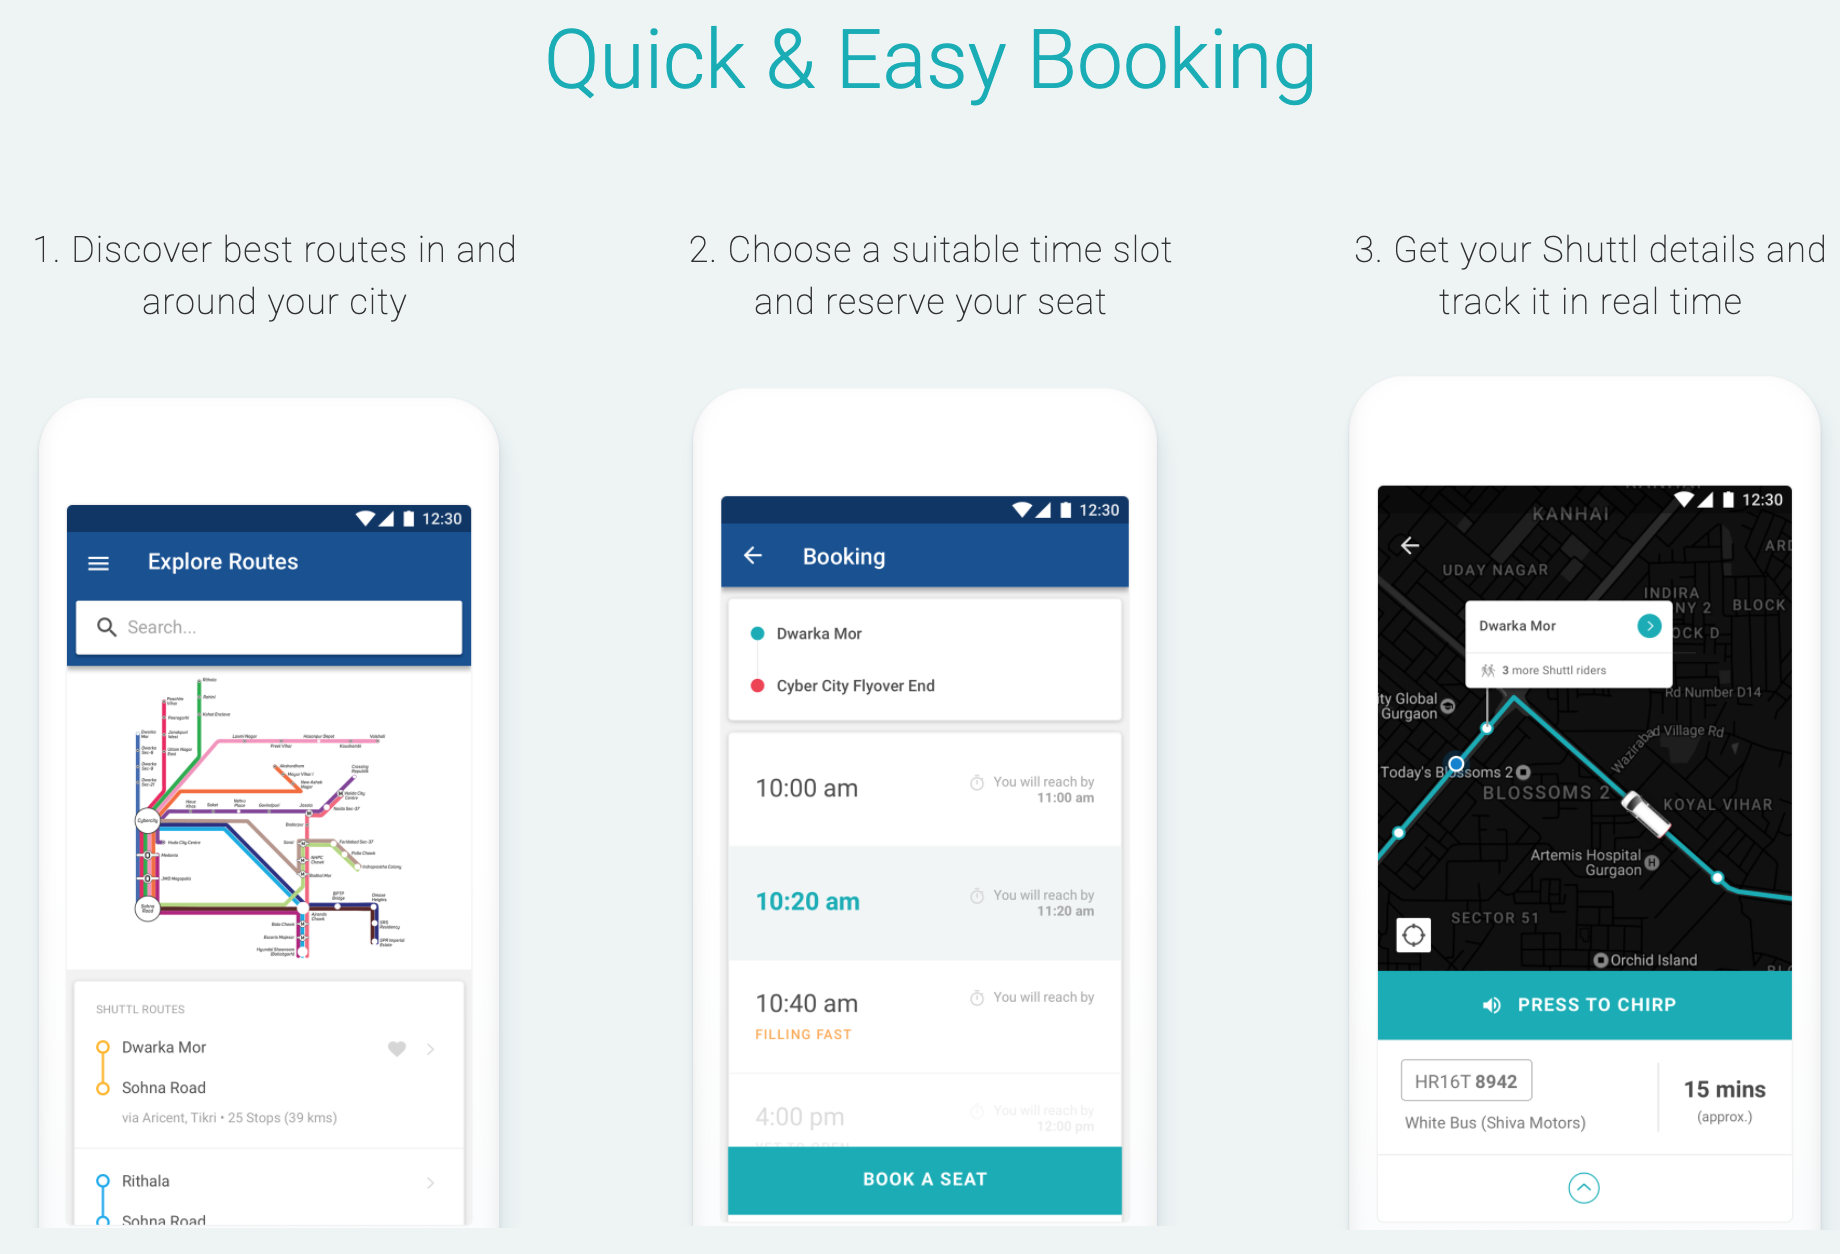
Determining the building blocks
Much like Uber, our driver apps send us GPS pings. We just need the traveling time from Shuttl’s location to the user’s pickup point right? Easy!
Well, not exactly. Unlike Uber and other cab providers, Shuttl buses don’t just go from point A to B; Shuttl runs buses on predetermined routes, with multiple boarding points(~30 stops on average). People can book a ride on any segment. For every trip (bus going from the first stop in the route, to the last), we need to know which way-points have been reached and the ETAs for all upcoming ones.
This information can be described using the following data-structure:
class TrackingDetails:
  trip_id: str
  bus_location: Location  # latest geo coordinate
  way_points: List[WayPointInfo]  # ordered as per their sequence in route!
  updated_at: datetime


class WayPointInfo:
  stop: Stop  # boarding points -geolocation, name etc.
  estimated_departure_time: datetime
  departed_at: Optional[datetime]  # null if not reached yet
This resource can be derived from the following sub-problems:
Trip-Progress: Given trip (geography, waypoint-locations) and driver’s GPS history determines which stops have been reached, and the current driver location.Trip-ETA-Predictor: Given a trip’s progress, predict reach times for all upcoming stops.
We can imagine the process as a pipe tracking_details = trip_progress(trip, gps_history) |> eta_predictor
The tracking_details are re-evaluated periodically for a trip during its lifetime (say every ~30s). Throughout our journey, our abstractions have held
but our implementation details have changed, I’ll refer to these building blocks in upcoming sections.
Onto the story!
Rewind to 2019, we’re in process of re-writing our backend systems into a service-oriented-architecture using DDD. By now we’d built numerous services for the platform, operations, and business verticals. I remember asking my team-lead to let me own tracking-eta piece next, little did I know the challenges ahead.
We developed it from scratch using the building blocks I mentioned before.
The Eta-Predictor implementation relied on Google directions API.
To summarize, this API would give travel time estimates (in seconds) between two geolocations.
We worked along with Analytics team to tweak the API-results for Shuttl’s domain (buses instead of cars, pickup-duration, etc.)
It’s a costly API, with limited usage quota. Moreover, Since it only provides estimates for a coordinate pair, we had to call it multiple times for stop-segments that lay ahead for a trip. We built various optimizations to reduce API-calls (limiting lookahead for future way-points / caching etc).
The whole re-write project (not just ETA), started going live mid-2019, city-by-city in India.
Flying blind
With all tests and instrumentation in place, things seemed good to go for ETA. narrator: Nope!
I did not foresee the enormous range of possible inputs in this pipeline, reliance on Google’ API was another thing to tame. This became apparent from the issues that were reported to me:
- ETA’s being off for trip x,y,z…
- Some users reporting ETA changing/jumping rapidly on their apps.
- Bus location not updating
..And many more. These issues lacked specifics/users-impacted, and I did not know where to start. What was clear though, is that I didn’t have visibility on some of the inputs and the quality of results produced by the system.
Capturing data and building tooling
To gain visibility, we started by capturing data. I use Datadog heavily for backend instrumentation, but this problem needed custom solutions for capturing and visualization.
We started by capturing every tracking-details evaluation for a trip, With these snapshots, we had
a history of ETA-values, stop-departures for each boarding-point as the trip progressed. So let’s plot it!
A lot going on here so let’s break it down:
- We plot time-series for each boarding-point, y-axis being the ETA in minutes, and the x-axis is the time of day (trips’ journey). In other words, each line represents the ETA that the passengers saw for that boarding point.
- Each series flatlines on the
x-axiswhen the boarding-point is reached. Notice that they flatline in order of waypoints. - Two additional y-axis markers denote the trip’s scheduled start time and actual start time (for the first stop).
Every data-point on this graph is from the snapshot of tracking-details.
With this graph we can answer:
- Were there jumps in ETA? Huge spikes instead of the smooth lines here.
- Was the driver late to start this trip?
- Something fishy in our calculations? intersecting lines / missing data-points.
But this graph doesn’t tell us about the accuracy of those ETA-values, so lets plot another!
This graph shows accuracy as time-series for each stop. The x-axis again is time(trip’s journey), the y-axis
is how-off was our prediction at this time (in minutes). An ideal graph would be a flat-line at 0 mins for all the stops.
How do we calculate the y-axis? Well, since we know when the stop was reached, we can calculate the diff predicted - actual.
-5 at the y-axis implies that we predicted 5 minutes early, +5 that we estimated more. We notice that
accuracy becomes better for farther away stops as the trip progresses. Some anomalies are also visible,
notice a couple for series go bizarre at the end? Turns out that these are last-stops in the journey,
some drivers can go off-path when there aren’t any more passengers remaining.
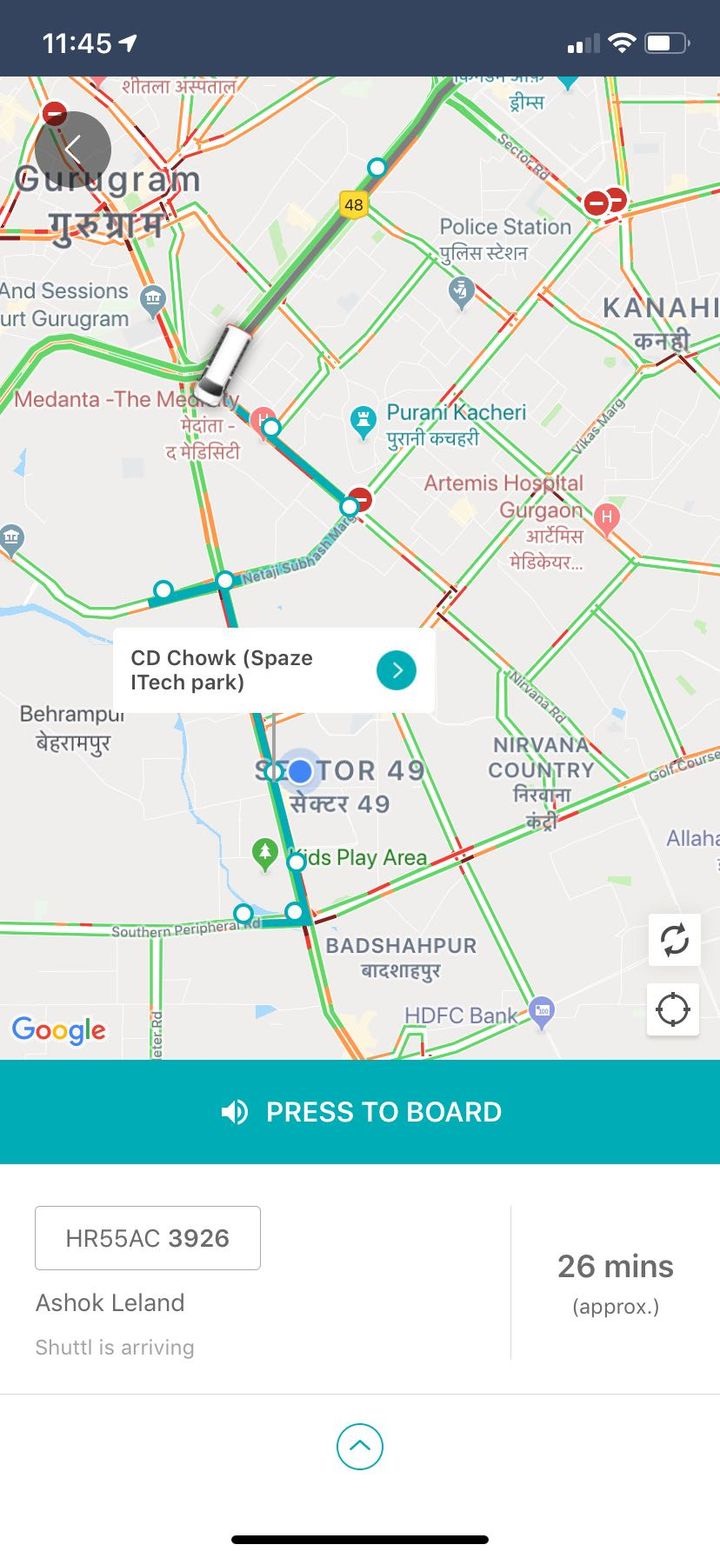
Some visibility on the quality of GPS data helps, let’s build a replay tool for the trip.
Each marker in this map is a bus-stop, a boarding-deboarding point.
With GPS replay we can tell:
- whether there were GPS issues - missing segments, unavailable altogether.
- Driver not adhering to route path
Road to better ETA
At this point we have good visibility, the tools are built into trip management frontend, and can be accessed with a click. Some issues could be directly resolved without reaching me, but many remained. I remember taking a few Shuttl rides, experiencing the trip as a passenger, and simultaneously watching the stats with my newly built tools.
The tooling helped surface the flaws in building-block implementations, some of which we fixed.
TripProgress: What do we do in case of missing GPS for segments? The whole experience can go off. We implemented recovery for such scenarios. Jupyter-notebooks and g-maps plugin helped in visualizing and experimenting with production data intuitively.
Since our building-blocks are fed onto the next one in the pipe, the quality of implementation in each drastically affects the output of the next.
ETA-predictor: Google can give varied results over time, which led to jumps in ETAs - The best route may be different than Shuttl’s path, GPS got snapped to the other side of the road / below the flyover. The error can compound because we need prediction for the next stop, the one after it, and so on. We’re also limited by our usage quota, during peak load, we’d get throttled by Google, and couldn’t update our ETAs in time!
While these tools give us insights for a single trip. It doesn’t tell much about city performance, or an aggregated performance score.
Well, since ETA is a critical part of our product-experience, Analytics measures the quality of ETA
using metrics like BOTD (bus-on-time for non-shuttlers reading this post 🙂). In brief,
it’s a percentage score of how many riders got accurate-enough info, aggregated over trips and cities.
This score hovered from ~65% for most cities.
So what’s next? By this time, we’re mostly focussed on implementing analytics models to better adapt Google’s ETA for Shuttl, while also making fewer API calls. But that changed soon…
Google Maps API Price Rise 💸
Welp, Google decided to increase API pricing, You can read more on it here and here.
This is not good news when your usage looks like this:
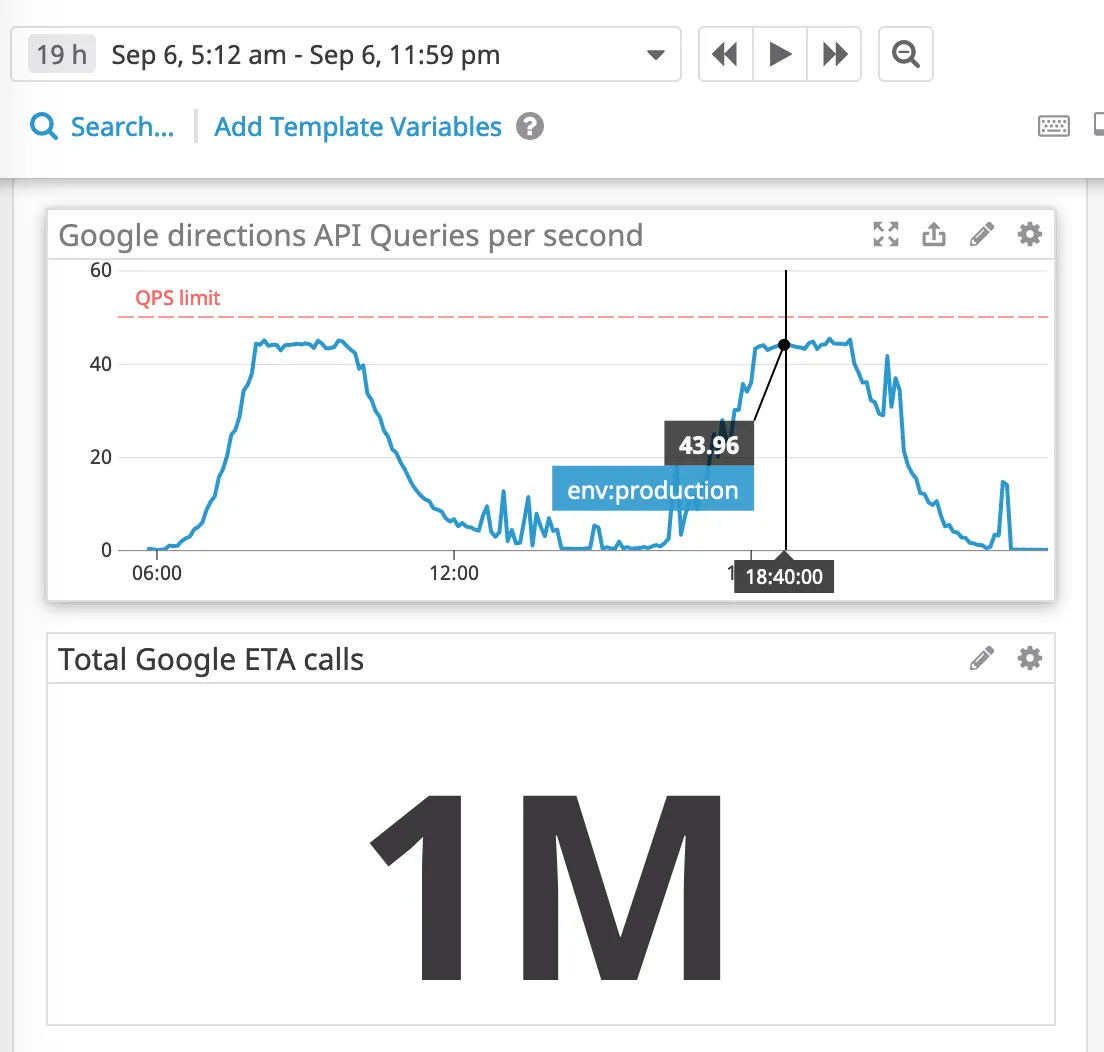
That’s 1 million in a day. New pricing could cost us $150,000 per month! We simply cannot afford this, So what now?
Analytics Eureka
Over time, we’d been collecting large sets of data for stop-departures from our trips. Analytics developed a route-segment model to predict travel time estimates!
Since we’re only concerned with stops-locations in our routes, we gather enough data-points with time for most
stop-pair combinations. The model works on time-series analysis on months of data and accounts for factors like bus-size,
time-of-day, seasonality, and more. With in-house predictions and a few minor run-time adjustments,
analytics developed their Quartz model.
We implemented this model in our Eta-predictor. We ran a pilot with a few routes and observed spectacular results.
The smooth graphs seen in the tools section are from the Quartz model. We’d never observed such pretty graphs before.
A day later, we flipped the switch to roll out Quartz for all India. That day we had the lowest
ever consumer complaints related to tracking and ETA! And we didn’t make a single request to Google for
trips that day.

Since then we’ve also implemented further improvements, such as propagating additional adjustments between trips in realtime - multiple Shuttl buses can travel the same stop-pair in a day, When a stop-segment is completed, trips to follow in the future can utilize fine-tuned predictions. This captures the more dynamic aspects of the day - eg. traffic variations.
A Data-Driven win
We’ve gone from ~65% BOTD score to ~90% - highest ever. i.e. 90% of bookings experience an on-time Shuttl.
We also dramatically reduced our costs, avoiding that hefty $150,000 per month in future bills.
This would not have been possible without elements of a data-driven org (First time I’ve observed such a thing):
- Data collection: Capturing every detail, cleanly, timely, and accurately.
- Accessible Data: Thanks to SRE, all this was readily available and easy to query in Athena.
- Reporting/Insights: We could discuss the performance on a trip level using tools/visualizations,
comment on aggregate performance with metrics like
BOTD, measure reduction in consumer-complaints attributed to ETA from customer care. When all related indicators move together in a positive direction, you know you’re doing something right! - Continuous improvement mindset: We’ve rolled out incremental improvements, and have mechanisms in place to pilot strategies in a controlled manner (even evaluating them on the side for purely analytical purposes).
Solving for the non-deterministic problem of ETA at Shuttl has been a fantastic journey, a true data-driven-win 🚀